Ice Studies/Services


file:///D:/Websites/ASL_WEBSITES/assets/images/871-2014-s-500x332.jpg

Ice from Above and Below


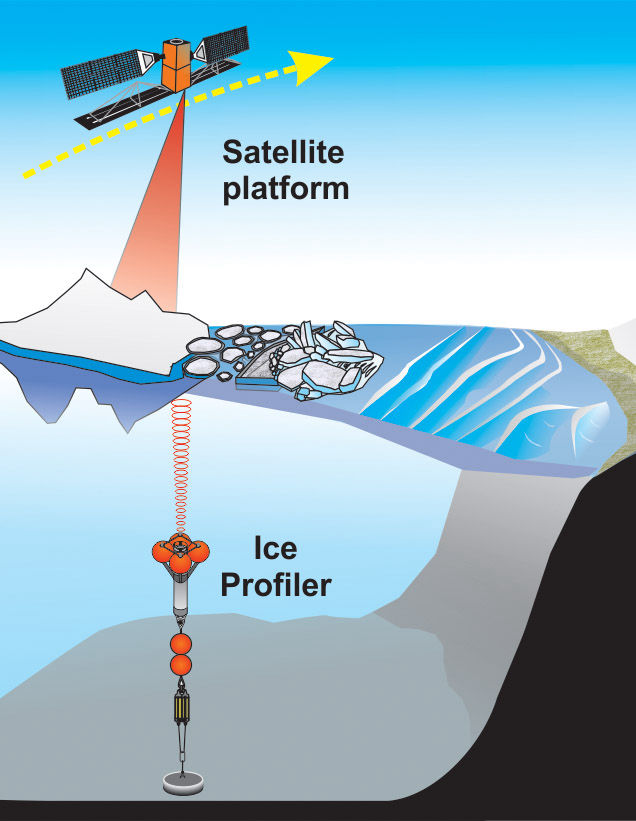
Click on the adjacent image to view an animation of how the Ice Profiling Sonar (IPS) samples ice draft from a bottom upward-looking mooring. The Radarsat image in the top right of the animation shows ice drifting over the sub-sea position of the IPS. The fixed position of the IPS is denoted by the red dot. 

Click on image to view IPS animation


file:///D:/Websites/ASL_WEBSITES/assets/images/871-2014-s-500x332.jpg

Full Complement of Ice Study Skills


ASL Environmental Sciences has developed a full complement of skills and specially designed instruments to study complex ice environments. Significant interest in Polar environments and the role of ice as a climate change indicator has positioned ASL Environmental Sciences as a world leader in this field. A large part of ASL’s history and its current activities have and continue to focus on diverse ice environs. These studies include the following:

  • Sea ice and iceberg
  • Lake and River ice
  • Permafrost.


Ice Profiling Sonar

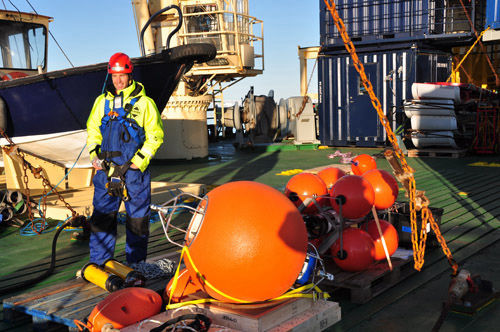
In 1996, ASL introduced its Ice Profiler™(IPS), an upward-looking sonar to measure sea ice keels to unprecedented accuracy and resolution. These instruments are now being used in ice-infested waters around the world. Along with deployment and recovery services, ASL offers software and complete data processing and analysis for the IPS. The data acquired by the IPS provides extremely detailed measurements of the ice canopy including individual ice keels, level ice draft thickness and open water segments for periods of several months or longer. When deployed with an ADCP, ice velocities and ocean currents can be calculated to add a spatial component to the ice drafts and help define some of the pack-ice driving forces at work. The list of successful projects utilizing the IPS is rapidly growing and includes such locations as the Beaufort Sea, Chukchi Sea, Sea of Okhotsk, Caspian Sea, the Greenland Sea and the Canadian East Coast. The animation below shows an example of IPS ice draft data as sea ice drifts above the bottom-mounted instrument. It is displayed here with a concurrent scene of RadarSat imagery. 


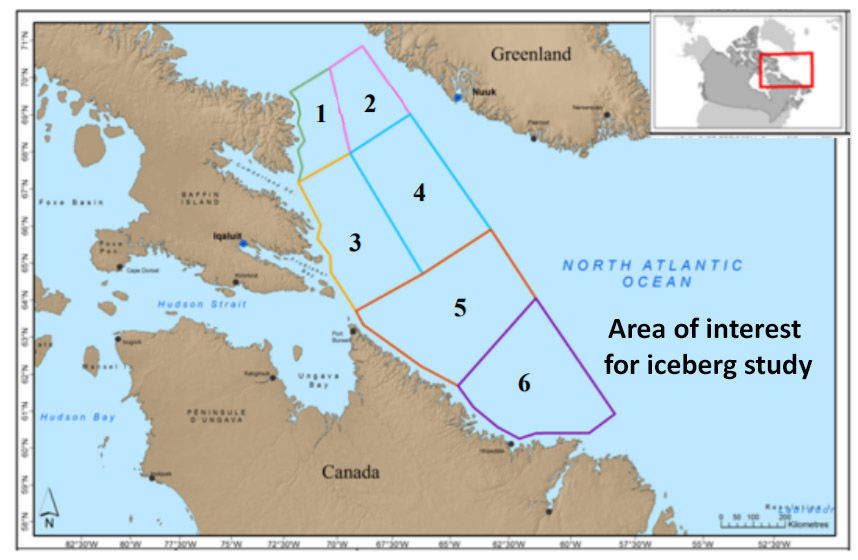
Iceberg Study
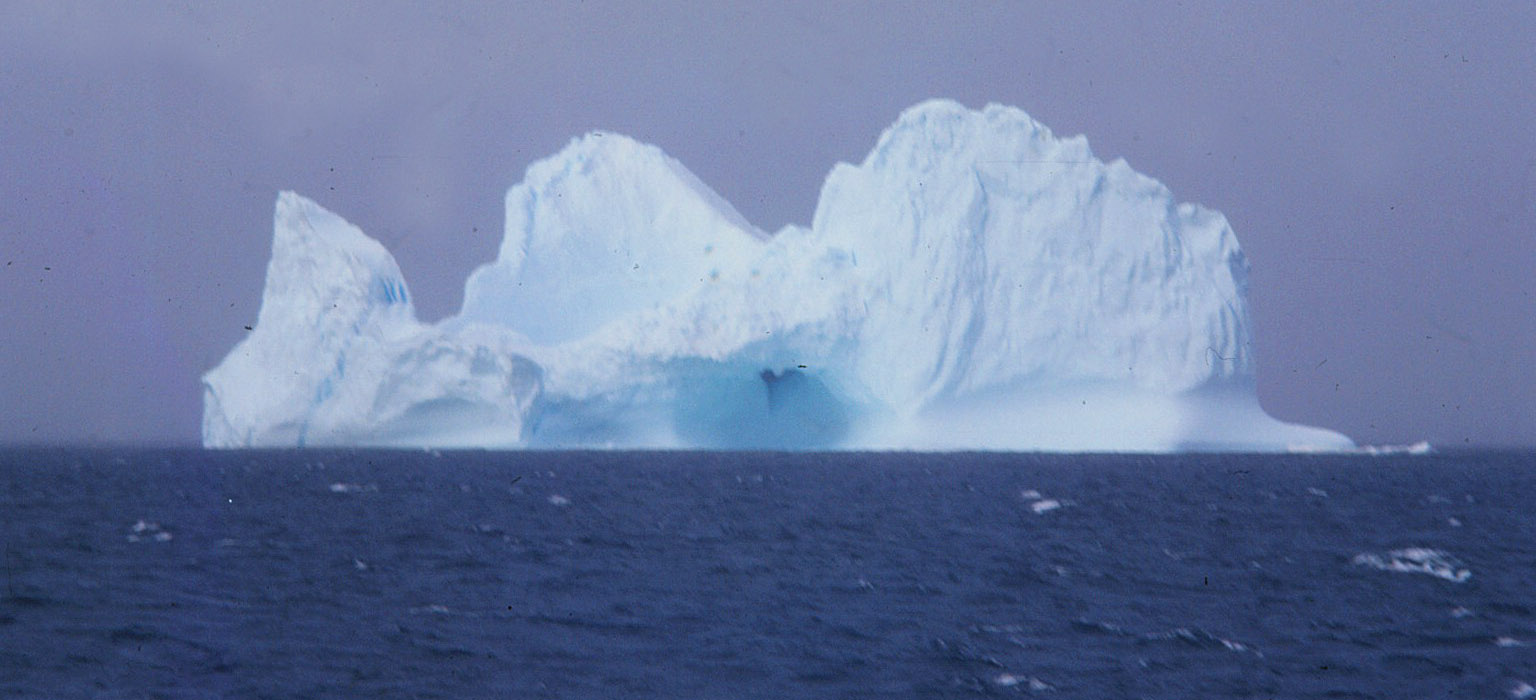
Iceberg

Sea Ice and Iceberg Studies 


ASL has used the expertise associated with the IPS product in its service contracts in support of offshore oil and gas projects in ice- infested waters including projects in Sakhalin Territory, Russia for Sakhalin Energy (Marathon Oil, then Shell Oil) and Exxon Neftegas and BP, in the Pechora Sea for Conoco Phillips and Lukoil, in the NE Caspian Sea of Kazakhstan for AgipKCO and Shell, St. Lawrence Seaway (Canadian Coast Guard, Petro-Canada/TransCanada Pipelines), Cook Inlet (ExxonMobil), and the Alaskan Beaufort Sea (Shell), the Chukchi Sea (Shell and ConocoPhillips) and the Canadian Beaufort Sea (Imperial Oil, BP and the Institute of Ocean Sciences). ASL also provides ice measurement equipment and services to research labs including the Institute of Ocean Sciences (Beaufort Sea), Eastern Arctic and Labrador Sea (Bedford Institute of Oceanography), Gulf of St. Lawrence (Public Works and Government Services Canada), the Sea of Okhotsk (Hokkaido University, Japan), Northeast Greenland (Norwegian Polar Institute and Chevron) and the Woods Hole Oceanographic Institution.


file:///D:/Websites/ASL_WEBSITES/assets/images/871-2014-s-500x332.jpg

Data Processing and Analysis Services


ASL Environmental Sciences Inc. covers a wide range of activities for data from Ice Profiler Sonar, ADCP and other moored instruments. These activities include the following:

  • Compilation of background data sets, particularly barometric pressure, winds and air temperatures from nearby weather stations, including data processing and plots;
  • compilation of ice charts from U.S. and Canadian ice agencies and satellite sources;
  • Plotting and editing of the ocean current profiles data sets as time series at three to four measurement levels for ADCPs and also for single level current meters; computation of statistical summaries;
  • Plotting and editing of the sea-ice velocities from the bottom tracking ADCPs, computation of statistical summaries;
  • Computation of the detailed ice draft time and distance series data sets based on the IPS range, pressure, temperature, tilt data sets and ice velocities;
  • Computation of ice draft large-keel statistical summaries, extremal value analysis and analysis of motion events.
Processing steps for the IPS data includes wave burst data removal of outlier data points and the generating of wave spectra and wave spectral parameters and to provide summary plots and statistics - these steps are of particular interest during the fall and summer periods when there was little or no ice. Several other processing steps include the plotting and editing of conductivity and temperature sensors and the computation of statistical summaries of these data; computing monthly ice thickness statistics by different ice types such as level ice, ridged and rubble thickness categories; preparing a data base of large keels (exceeding three user specified threshold levels); analyzing extreme ice keel draft features and computing ice draft at 100 year recurrence interval; identifying rubbled ice features and compiling statistical summaries; computing monthly ice speed versus direction and versus ice draft statistics; computing extreme value projections of ice drift speeds; identifying icebergs in the data sets, if present less Similar analysis methods can be applied to other types of ice and oceanographic data sets, including satellite-tracked drifting ice beacon data.

file:///D:/Websites/ASL_WEBSITES/assets/images/871-2014-s-500x332.jpg

Real-time Ice Measurement Systems


ASL has developed real-time ice measurement systems over the past decade:
  • A real-time IPS/ADCP system operated in the St. Lawrence Seaway from 2002 to 2007 in support for ship navigation;
  • A real-time IPS system operated off the Confederation Bridge in Northumberland Strait in Eastern Canada from 2005 to 2008; and
  • A real-time IPS system in the shallow waters of the NE Caspian Sea, operated from 2009 to the present.
ASL is presently involved in the design of real-time ice measurements systems being considered for operation in deeper Arctic waters, involving multiple measurement locations spanning horizontal distances of 0.5 to 30 km. For the ice measurement systems spanning distances of 1.5 km or more, ASL is working with Ocean Networks Canada of the University of Victoria to apply the technology developed for the VENUS and NEPTUNE Canada cabled fibre optics ocean observatory systems to ice and Arctic real-time ice measurement systems.

Sea Ice Numerical Modeling


ASL numerical modeling capabilities include Arctic and sea ice applications such as contributions to the development of the Canadian Ice Service operational ice models for the Canadian East Coast and the Canadian Beaufort Sea (1991–2000), development of coupled sea ice-ocean circulation models for the Canadian East Coast for the Canadian Department of Fisheries and Ocean’s Bedford Institute of Oceanography (2001-2005), modeling of the disposal and dispersion of drill cuttings in the Canadian Beaufort Sea (2009), development and operation of a model to provide one to five day forecasts of pack ice edge locations in the Alaskan Beaufort Sea in support of tug-based resupply operations for northern Alaskan ports (2010).


Sea Ice Data Products
(Derived from Remote Sensing)


ASL now offers more capabilities for sea ice analyses with the availability of enhanced remote sensing through a merger with Borstad Associates. This provides improved data products for characterization of sea ice. Using historical ice data sets from many sources, ASL provides pertinent ice information for input to engineering design. See brochure.

file:///D:/Websites/ASL_WEBSITES/assets/images/871-2014-s-500x332.jpg


CHOIRS: Characterization of Hazardous Ocean Ice using RADARSAT and ice profiling Sonar


This research project combines two technologies: the “view from above” using RADARSAT-2 satellite imagery and the “view from below” using ASL’s renowned acoustic instrumentation. Together they provide an exciting, comprehensive view of sea ice, and allow validation of information products such as draft and type.

file:///D:/Websites/ASL_WEBSITES/assets/images/871-2014-s-500x332.jpg

Sea Ice Data Products – Derived from Remote Sensing Sea Ice Concentrations including total ice concentrations and by ice type (e.g. multi-year, first year, new ice) for local, regional or shipping corridor operational areas for specific times of the year. Ice floe sizes and shapes, including density distributions, orientations and information on open water leads separating the floes. Ice Velocities are derived from sequential satellite image scenes, and estimates are derived from computation of wind and ocean current forcing. The statistical summaries of the above quantities can be presented in a wide range of map-based or tabular formats, including frequency of occurrence and recurrence intervals of specified ice types and for open water. The ice information derived from remote sensing data sources is highly complementary to the sea ice information products that ASL provides based on moored upward looking sonar instruments, including ASL's Ice Profiler ™(see above animation).


ASL Environmental Sciences #1-6703 Rajpur Place V8M 1Z5 Saanichton, BC
Canada

Phone: +1 250-656-0177
Email: [email protected]
Website:www.aslenv.com